Preview and code
The right side of the builder shows your running app so you can try pages and forms while you build. From the bar at the top, you can switch between the live preview and the code editor, move between pages, refresh the current page, and open the console logs.

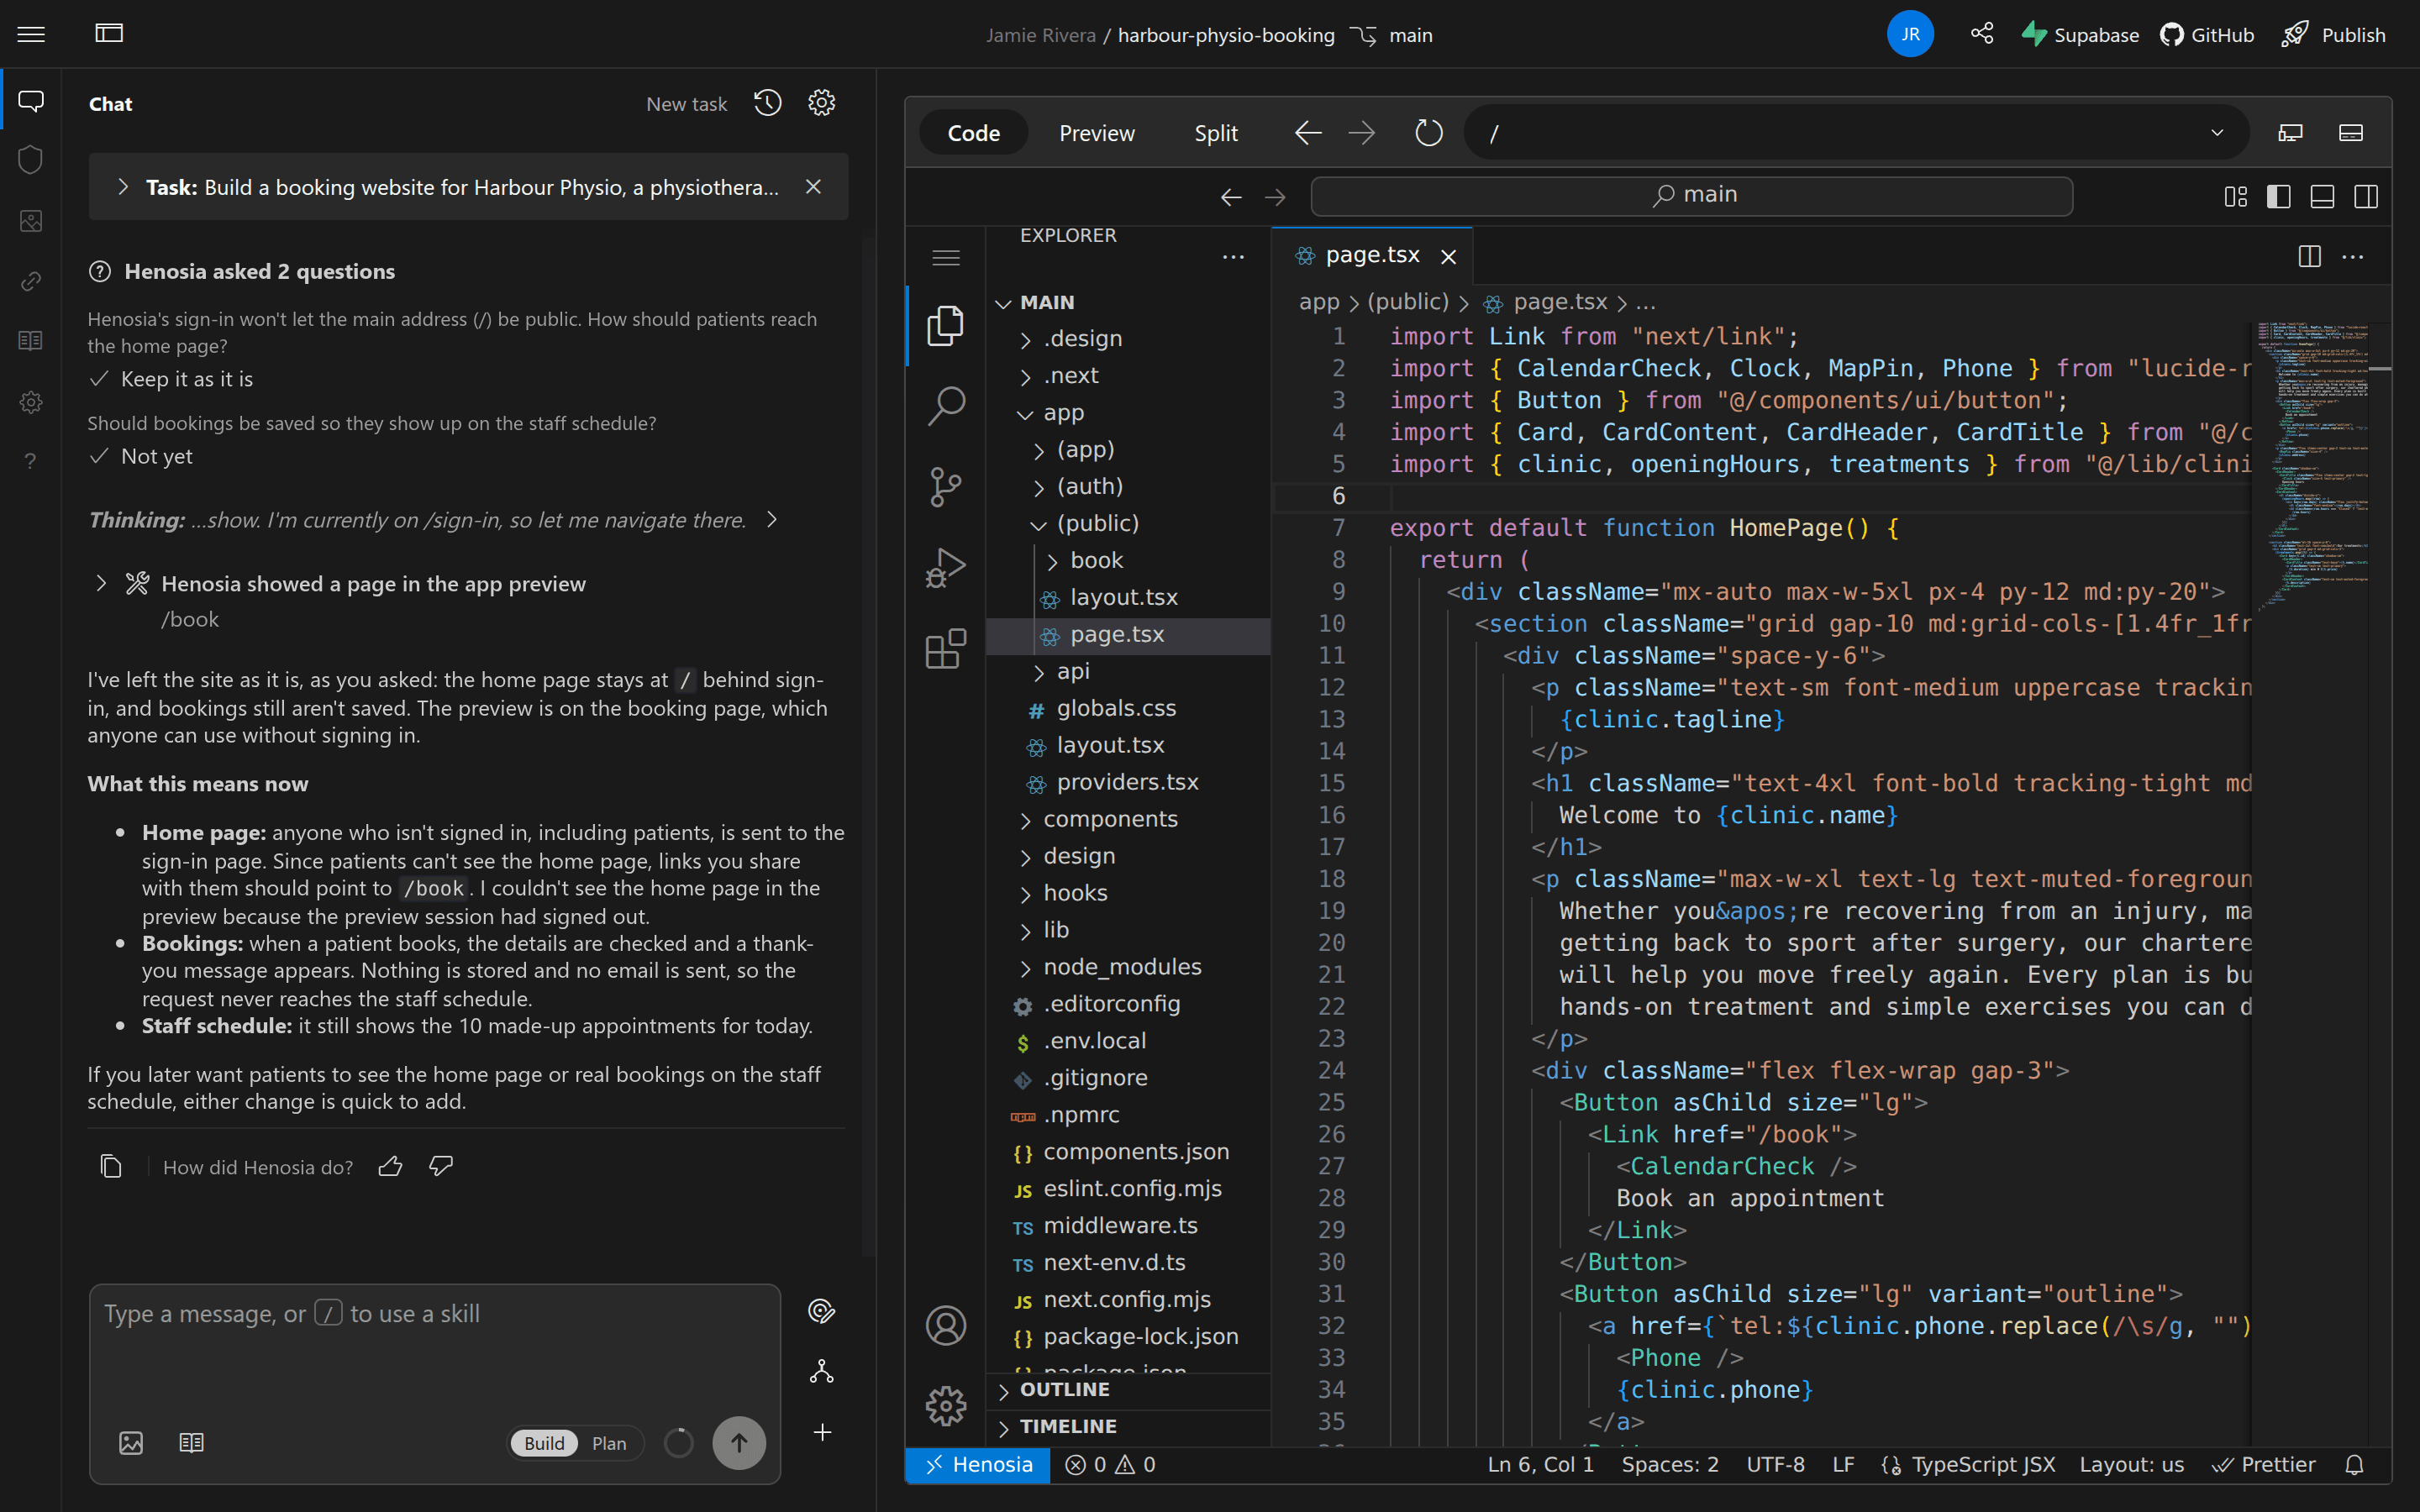
Preview, Code, and Split
The three tabs on the left of the view bar control what appears in the builder:
- Preview is the default. It shows your live app next to the chat so you can click links, fill in forms, and test how people will use it. If clicking an element selects it for visual editing instead of activating a link or button, turn off Select to edit next to the prompt field (or press
P) to interact with the page normally. - Code replaces the preview with a built-in VS Code editor and keeps the chat open on the left. Use it when you want to read or edit project files directly and search across the codebase.
- Split puts the code editor in the left column (in place of the chat) and keeps the live preview on the right, with the visual editing buttons between them. Choosing Edit code at selection from the right-click menu on a selected element in the preview also opens Split.
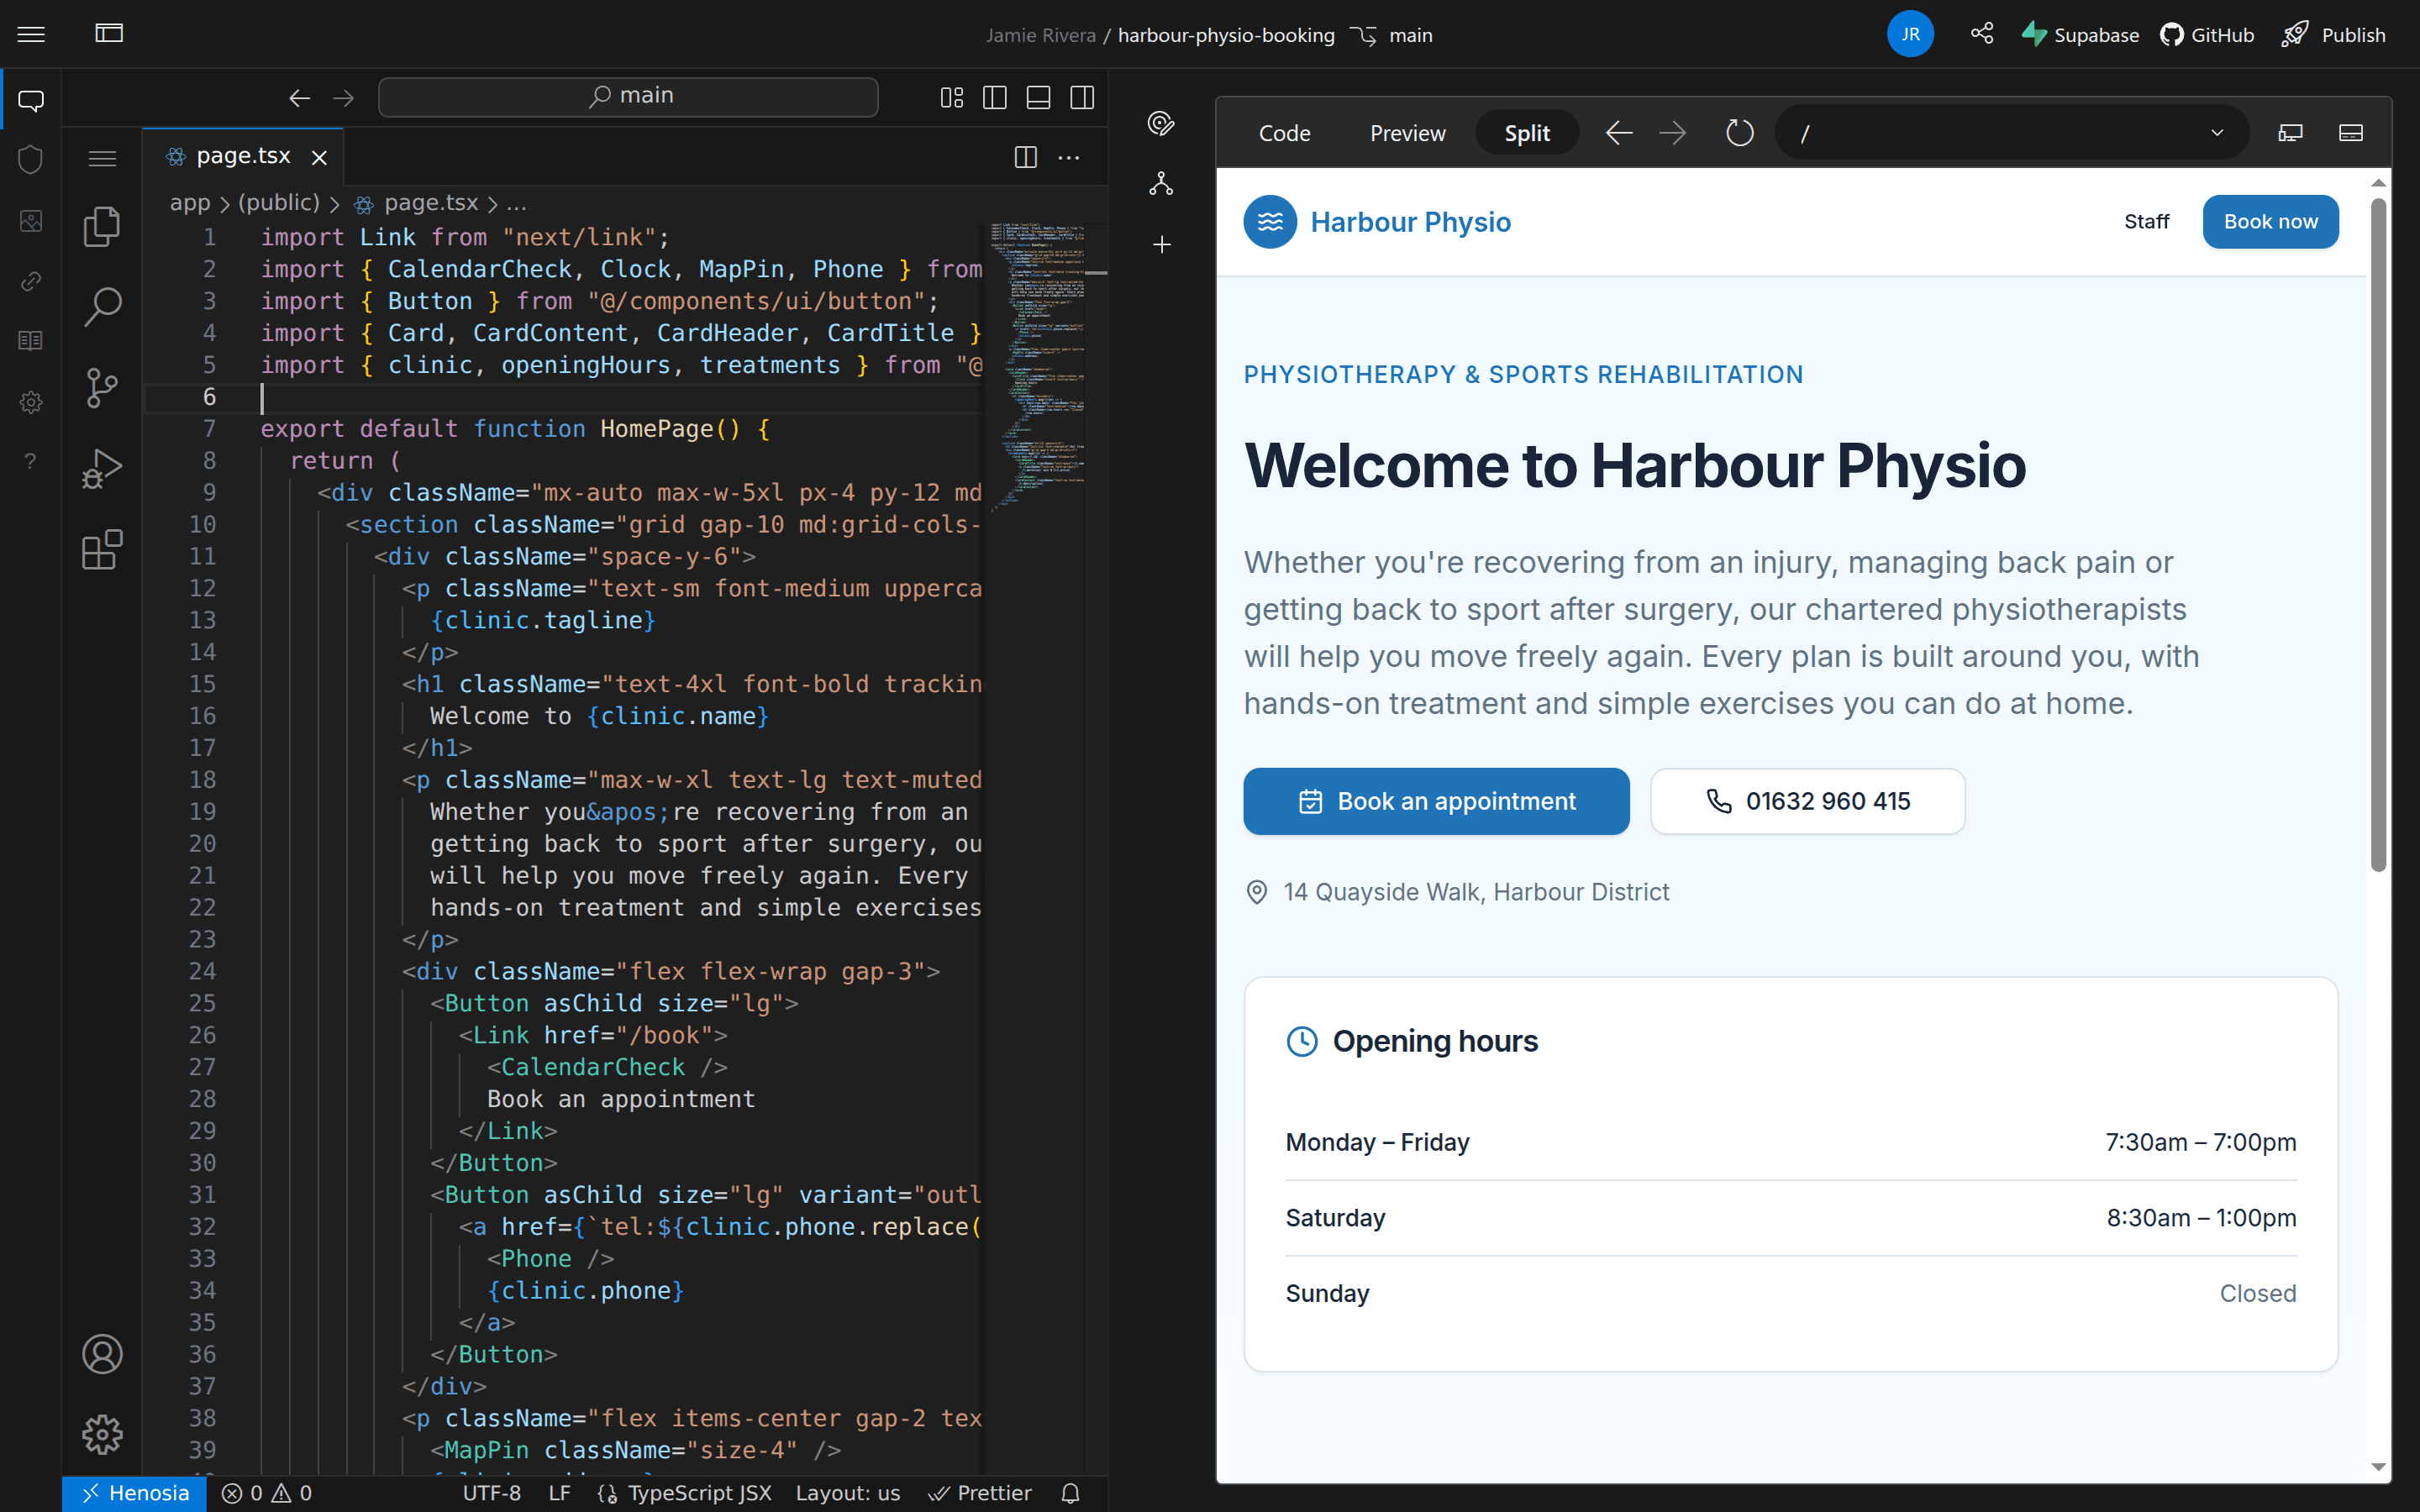
Changes you make in the editor save automatically when focus leaves the file (as long as the file has no syntax errors), and the preview reloads with your edits. While Henosia works on a task, it switches from Code back to Preview when it checks a page, and the builder returns to Preview when a build finishes.
Switch pages and addresses
The address bar in the middle of the view bar shows the path of the page currently open in the preview, including any query parameters, such as / or /book.
Choose the address bar to open a list of the pages found in your project's files, with a checkmark next to the current page. Pick any page in the list to open it in the preview, or pick the current page again to reload it.
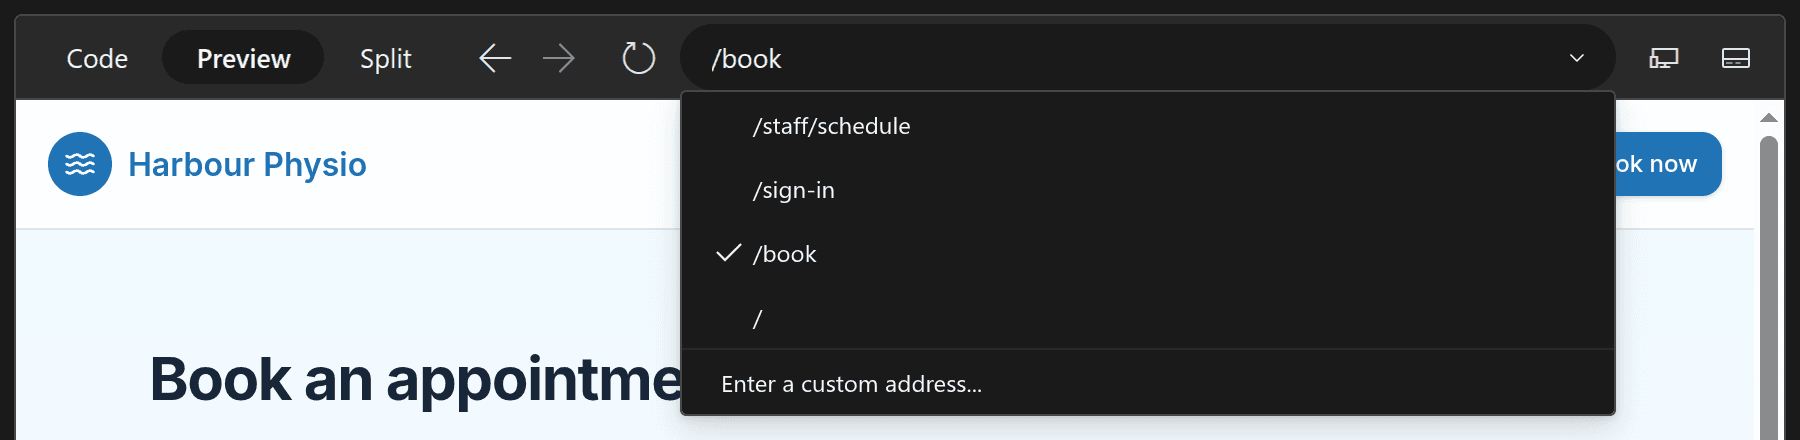
Dynamic routes such as /treatments/[slug] appear in the list too. Choosing one opens a short form in the preview where you fill in the placeholder value and choose Open page.
To jump straight to a specific path or query string, such as /treatments/sports-massage or /staff/schedule?day=today, choose Enter a custom address... at the bottom of the menu, enter the path starting with / when your browser asks for the preview URL, and confirm.
Go back, forward, and refresh
To the left of the address bar, Back and Forward step through the pages you've visited in the preview across both links you clicked in your app and pages you opened from the address bar.
Choose Refresh (the circular arrow) to reload the current page in the preview while keeping your address and history.
If a page stays blank or out of date after Refresh, open Menu in the top-left corner and choose View > Restart the preview to restart the dev server behind it, or View > Restart and reset the preview to clear its build cache as well. When a build error stops the preview from loading, a red banner below the view bar offers Attempt fix so you can hand the error to Henosia.
Hide the sidebar
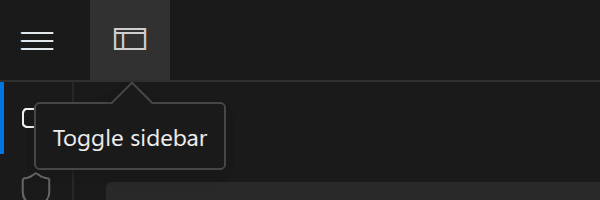
While Chat or Assets is open in the left toolbar, choose Toggle sidebar right next to Menu in the top-left corner to hide the left toolbar and sidebar so your preview or code editor fills the full width of the builder. In Split, Toggle sidebar collapses the code pane so the preview takes the full width. Choose Toggle sidebar again to bring it back.
You can also drag the divider on the right edge of the sidebar (or between the code editor and preview in Split) to widen or narrow either side without hiding it.
Check different screen widths
The Toggle responsive preview button (the monitor-and-phone icon on the right side of the view bar) isn't implemented yet and shows a notice to resize the window manually.
To check how your app adapts to narrower or wider screens today:
- Resize your browser window to test mobile and tablet widths.
- Drag the divider beside the preview to narrow or widen the preview area.
- Choose Toggle sidebar in the top-left corner to check the layout at the full width of your window.
Read console logs
Choose Toggle the browser and server console logs panel at the far right of the view bar to open Console logs at the bottom of the preview. Drag the top edge of the panel to make it taller or shorter.
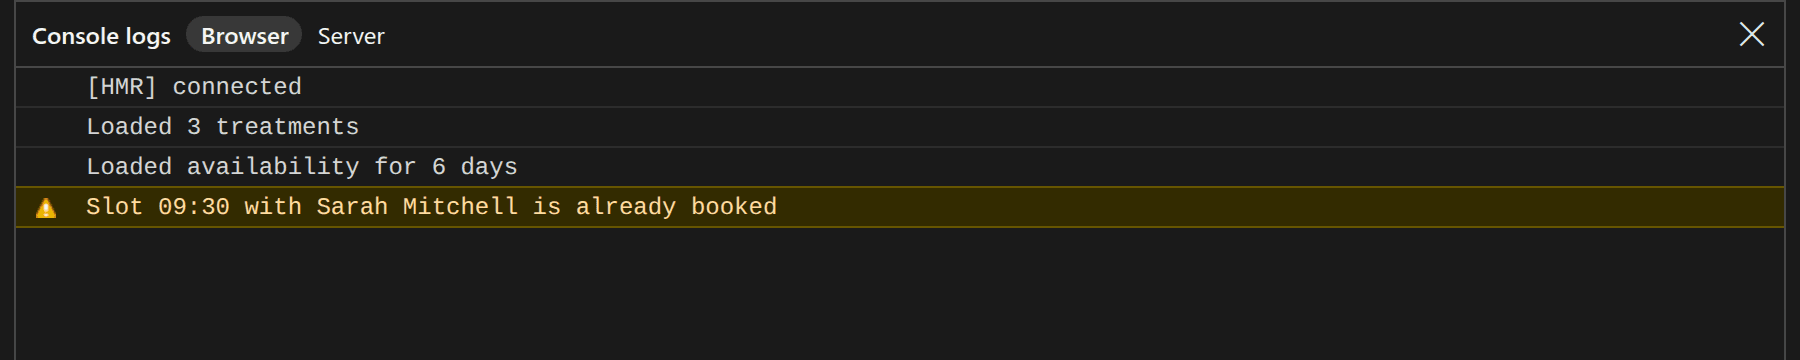
The panel has two tabs:
- Browser shows messages, warnings (in yellow), and errors (in red) logged in the browser while you use the preview. It clears on each full page load.
- Server shows timestamped page and API requests along with output from the dev server running your project, plus browser warnings and errors forwarded with a
[browser]prefix.
When a button does nothing on click or data fails to load, check both tabs and paste any error lines into the chat so Henosia can see what went wrong. Choose Hide log panel (or choose the console button in the view bar again) to close the panel.